Analysis of PRTR data
Annual PRTR Data
The each annual report shows PRTR data by substances and industries, estimation of amount non-subject to notification and mobile source.
- Result of FY2015 PRTR Data (Last Update: Mar. 2017) [EXCEL : 266KB]
- Result of FY2014 PRTR Data (Last Update: Mar. 2017) [EXCEL : 269KB]
- Result of FY2013 PRTR Data (Last Update: Mar. 2017) [EXCEL : 279KB]
- Result of FY2012 PRTR Data (Last Update: Mar. 2017) [EXCEL : 269KB]
- Result of FY2011 PRTR Data (Last Update: Mar. 2017) [EXCEL : 273KB]
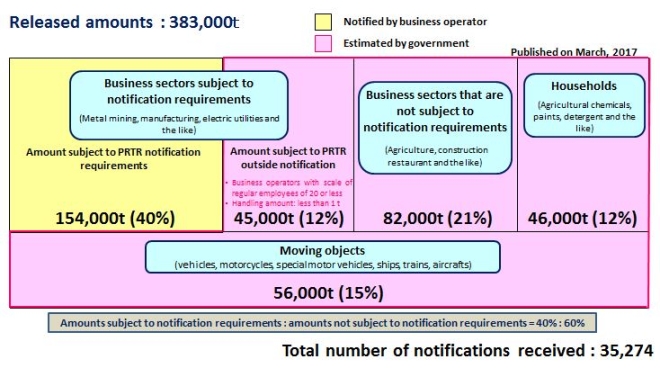
Breakdown of FY2015 PRTR Data
Comparison Previous Year
The comparison reports show the trend of the reported data by substances and industries.
PRTR map
The PRTR map website closed on March 31, 2024.
Data on exposure, estimated concentration, and so on are available on the new site for data download.
The site is only Japanese available.
https://www.nite.go.jp/chem/prtr/mapdata/index.html
Contact us
- National Institute of Technology and Evaluation